

Speeding up the JavaScript ecosystem - eslint

tl;dr: Linting is the act of finding patterns in code that could lead to mistakes or ensure a consistent reading experience. It's a core piece of many JavaScript/TypeScript projects. We found lots of potential for time savings in their selector engine and AST conversion process and a perfect linter written in JS would be able to hit sub-second run times.
- Part 1: PostCSS, SVGO and many more
- Part 2: Module resolution
- Part 3: Linting with eslint
- Part 4: npm scripts
- Part 5: draft-js emoji plugin
- Part 6: Polyfills gone rogue
- Part 7: The barrel file debacle
- Part 8: Tailwind CSS
- Part 9: Server Side JSX
- Part 10: Isolated Declarations
- Part 11: Rust and JavaScript Plugins
- Part 12: Semver
- Part 13: oxlint and oxfmt
We've talked quite a bit about linting in the past two posts of this series, so I thought it's time to give eslint the proper limelight it deserves. Overall eslint is so flexible, that you can even swap out the parser for a completely different one. That's not a rare scenario either as with the rise of JSX and TypeScript that is frequently done. Enriched by a healthy ecosystem of plugins and presets, there is probably a rule for every use case out there and if there isn't, the excellent documentation guides you on how to create your own rules. That's one thing I want to highlight here as it's a project that has stood the test of time.
But this also poses a problem for performance profiling as due to the vastness of the configuration flexibility two projects can have a widely different experience when it comes to linting performance. We need to start somewhere though, so I figured what better way to start our investigation than to look at the linting setup used in the eslint repository itself!
Using eslint to lint eslint
Their repository uses a task runner abstraction to coordinate common build tasks, but with a little bit of digging we can piece together the command that is run for the "lint" task, specifically for linting JavaScript files.
node bin/eslint.js --report-unused-disable-directives . --ignore-pattern "docs/**"Neat, here you have it: Eslint is using eslint to lint their codebase! Like in both previous articles of this series we'll be generating a *.cpuprofile via node's built-in --cpu-prof argument and we'll be loading that into Speedscope for further analysis. A few seconds later (22s to be exact), we are ready to dive in!
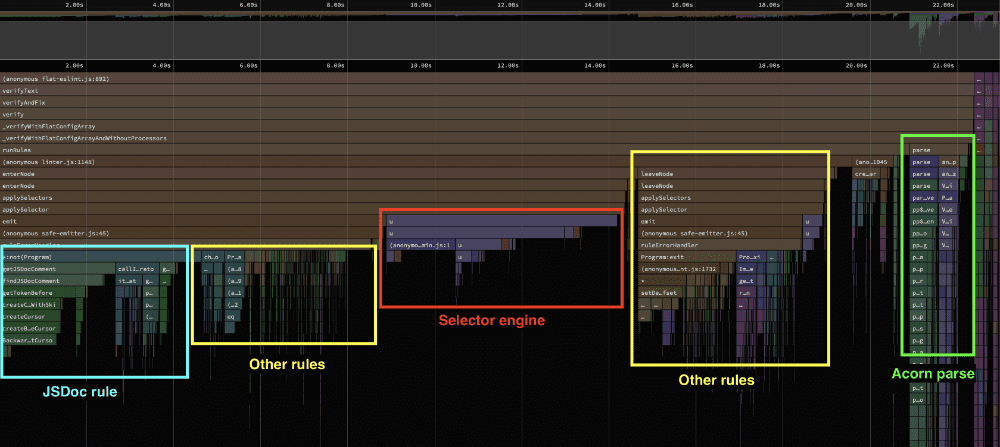
By merging similar call-stacks together we get a much clearer picture of where the time is being spent. This is typically referred to as a "left-heavy" visualization. This is not to be confused with your standard flamegraph where the x-axis represents when a call happened. Instead, in this style the x-axis represents time consumed of the total time, not when it happened. To me it's one of the main benefits of Speedscope and it feels much snappier too. Wouldn't have expected any less since it's written by a few devs from Figma who are known for their excellence in engineering in our industry.
Immediately we can make out a few key areas where the linting setup in eslint's repository is spending time. The main things that stand out is that a good chunk of the total time is spent on rules dealing with JSDoc as inferred from their function names. Another interesting aspect is that there are two different parsers running at various times during the lint task: esquery and acorn. But my curiosity was piqued by the JSDoc rules taking so long.
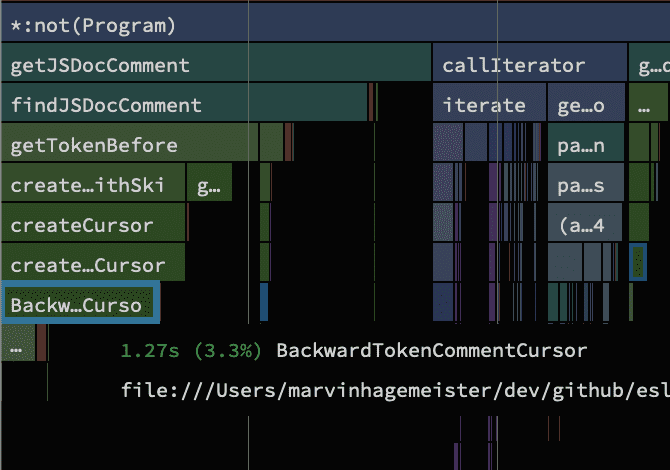
One particular BackwardTokenCommentCursor entry seems to be of interest as it's the largest block of the bunch. Following the attached file location to the source, it seems to be a class that holds the state of where we are in a file. As a first measure I added a plain counter that increments whenever that class is instantiated and ran the lint task again.
On getting lost 20 million times
All in all, this class has been constructed more than 20 million times. That seems quite a lot. Remember, any object or class we instantiate takes up memory, and that memory later needs to be cleaned up. We can see the consequence of that in the data where garbage collection (the act of cleaning up memory) takes 2.43s in total. That's not good.
Upon creating a new instance of that class it calls two functions which both seem to kick off a search. Without knowing more about what it's doing the first one can be ruled out though as it doesn't contain any form of loops. From experience, loops are usually a prime suspect to investigate for performance, so I usually start my search there.
The second function though, called utils.search(), contains a loop. It loops over the stream of tokens that were parsed from the contents of the file we were linting at the time. A token is the smallest building block of a programming language and you can think of them being the "words" of a language. For example in JavaScript the word "function" is typically represented as one function token, and so is a comma or a single semicolon. In this utils.search() function we seem to be concerned with finding the nearest token to our current position in the file.
exports.search = function search(tokens, location) {
	const index = tokens.findIndex(el => location <= getStartLocation(el));
	return index === -1 ? tokens.length : index;
};
To do that the search is done on the token array via JavaScript's native .findIndex() method. The algorithm is described as:
The
findIndex()is an iterative method. It calls a providedcallbackFnfunction once for each element in an array in ascending-index order, untilcallbackFnreturns a truthy value.
Given that the array of tokens grows with the amount of code we have in a file, that doesn't sound ideal. There are more efficient algorithms to search a value in an array that we can use rather than going through every element in the array. Replacing that line with a binary search for example cuts the time in half.
Whilst a 50% reduction seems good, it still doesn't address that this code is called 20 million times. To me that's the real issue. We're more or less trying to reduce the impact of the symptoms here instead of addressing the underlying problem. We're already iterating through the file so we should know exactly where we are. Changing that requires a more invasive refactor though and would be too much to explain for this blog post. Seeing that this wouldn't be an easy fix I checked what else is worthy of attention in the profile. The long violet bars in the center are hard to miss, not just because they're a different color, but because they take up a lot of time and are not drilled down into hundreds of smaller function calls.
The selector engine
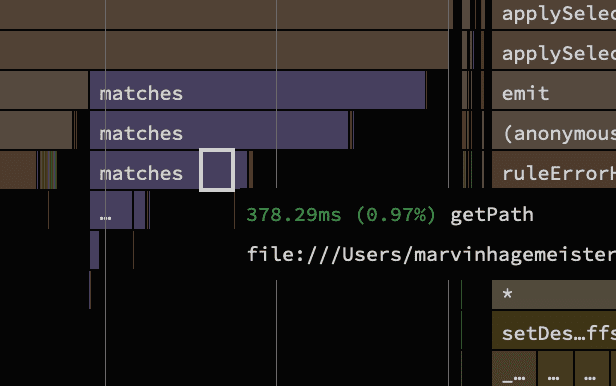
The callstack in speedscope points to a project called esquery which I hadn't heard about prior to this investigation. It's an older project whose goal is to be able to find a specific object in the parsed code through a small selector language. If you squint a little you can see the strong resemblance to CSS selectors. And they work the same way here, just that we're not finding a specific HTML element in the DOM tree, but rather an object in another tree structure. It's the same idea.
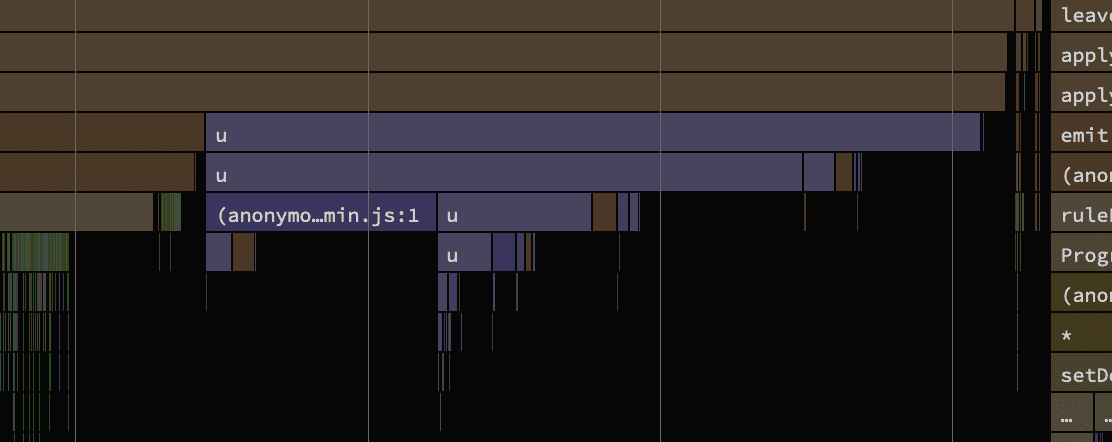
The traces indicate that the npm package ships with minified source code. Mangled variable names which are typically a single character strongly hint at such a process being in place. Luckily for me, the package also ships an unminified variant as well so I just modified the package.json to point at that instead. Another run later and we're greeted with the following data:
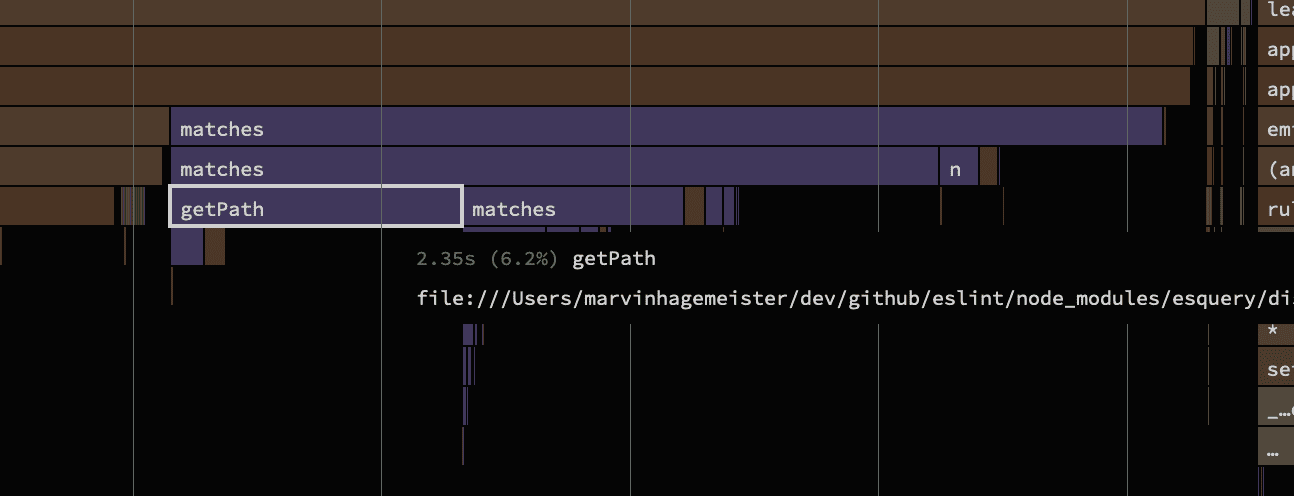
Much better! A thing to keep in mind with unminified code is that it performs about 10-20% slower than the minified variant. That's a rough approximate range which I've measured many times throughout my career when comparing the performance of minified to unminified code. Nonetheless, the relative timings stay the same, so it remains perfect for our investigation. With that the getPath function seems like something that could use a little help.
function getPath(obj, key) {
	var keys = key.split(".");

	var _iterator = _createForOfIteratorHelper(keys),
		_step;

	try {
		for (_iterator.s(); !(_step = _iterator.n()).done; ) {
			var _key = _step.value;

			if (obj == null) {
				return obj;
			}

			obj = obj[_key];
		}
	} catch (err) {
		_iterator.e(err);
	} finally {
		_iterator.f();
	}

	return obj;
}
Outdated transpilation will haunt us for a long time
If you've been around the JavaScript tooling space for a while these functions look awfully familiar. _createForOfIteratorHelper is with 99.99% certainty a function that was inserted by their publishing pipeline and not by the authors of this library. When for-of loops were added to JavaScript it took a while until it was supported everywhere.
Tools that downtranspile modern JavaScript features tend to err on the side of caution and rewrite the code in a very conservative way. In this case we know that we're splitting a string into an array of strings. To loop over that using a full blown iterator is totally overkill and a boring standard for loop would've been all that was needed. But since tools are not aware of that, they went with the variant that covers the most scenarios possible. Here is the original code for comparison:
function getPath(obj, key) {
	const keys = key.split(".");
	for (const key of keys) {
		if (obj == null) {
			return obj;
		}
		obj = obj[key];
	}
	return obj;
}
In today's world for-of loops are supported everywhere, so I patched the package again and swapped out the function implementation with the original one in the source. This one single change saves about 400ms. I'm always impressed by how much CPU time we burn on wasteful polyfills or outdated downtranspilation. You'd think that it makes much less of a difference, but then you came across a case such as this where the numbers paint a different picture. For what it's worth I also measured replacing the for-of loop with a standard for loop.
function getPath(obj, key) {
	const keys = key.split(".");
	for (let i = 0; i < keys.length; i++) {
		const key = keys[i];
		if (obj == null) {
			return obj;
		}
		obj = obj[key];
	}
	return obj;
}
Surprisingly, this netted another 200ms improvement compared to the for-of variant. I guess even today, for-of loops are harder to optimize for engines. That reminds me of a past investigation Jovi and I did into a sudden slow down in the parsing speed of the graphql package when they made a new release in which they switched to for-of loops.
It's something a v8/gecko/webkit engineer can properly verify, but my assumption would be that it still has to invoke the iterator protocol as that could have been globally overwritten, which would change the behavior for every single Array. It's probably something like that.
Whilst we got some quick wins out of those changes, it's still far from ideal. Overall the function remains a top contender to be improved as it is alone responsible for a couple of seconds of the total time. Applying the quick counter hack again reveals that it's called about 22k times. For sure a function that's somewhat in the "hot" path.
Of particular note in many performance intensive code that deals with strings revolves around the String.prototype.split() method. This will effectively iterate over all characters, allocate a new array and then iterate over that, all of which could be done in a single iteration.
function getPath(obj, key) {
	let last = 0;
	// Fine because all keys are ASCII and not unicode
	for (let i = 0; i < key.length; i++) {
		if (obj == null) {
			return obj;
		}

		if (key[i] === ".") {
			obj = obj[key.slice(last, i)];
			last = i + 1;
		} else if (i === key.length - 1) {
			obj = obj[key.slice(last)];
		}
	}

	return obj;
}
This rewrite had a strong impact on its performance. When we started getPath took 2.7s in total and with all optimizations applied we managed to get that down to 486ms.
Continuing with the matches() function, we see a lot of overhead created by weird for-of downtranspilation, similar to what we've seen earlier. To save some time I just went on github and copied the function from the source code directly. Since matches() is even more prominent in the traces, this change alone saves a full 1s.
So many libraries in our ecosystem suffer from this issue. I really wish there was a way to update them all with one click. Maybe we need a reverse transpiler which detects down transpilation patterns and converts it back to modern code again.
I reached out to jviide to see if we could optimize matches() further. With his additional changes we were able to make the whole selector code about 5x faster compared to the original unmodified state. What he basically did is get rid of a bunch of overhead in the matches() function which allowed him to simplify a couple of related helper functions too. For example he noticed that template strings were down transpiled poorly.
// input
const literal = `${selector.value.value}`;

// output: down transpiled, slow
const literal = "".concat(selector.value.value);
He went even a step further by parsing each new selector into a chain of function calls on the fly and caching the resulting wrapper function. This trick netted him another hefty speedup for the selector engine. I highly recommend checking out his changes. We haven't opened a PR because esquery seems to be unmaintained at this point.
EDIT: We did open a PR in the end.
Bailing out early
Sometimes it's good to take a step back and tackle the problem from a different angle. So far we looked at implementation details, but what kind of selectors are we actually dealing with? Is there potential to short circuit some of them? To test that theory I first needed to get a better overview of the kind of selectors that are being processed. Unsurprisingly, the majority of selectors were short. A couple of them though are quite the character soup. This for example here is a single selector:
VariableDeclaration:not(ExportNamedDeclaration > .declaration) > VariableDeclarator.declarations:matches(
  [init.type="ArrayExpression"],
  :matches(
	[init.type="CallExpression"],
[init.type="NewExpression"]
  )[init.optional!=true][init.callee.type="Identifier"][init.callee.name="Array"],
[init.type="CallExpression"][init.optional!=true][init.callee.type="MemberExpression"][init.callee.computed!=true][init.callee.property.type="Identifier"][init.callee.optional!=true]
	:matches(
  	[init.callee.property.name="from"],
  	[init.callee.property.name="of"]
)[init.callee.object.type="Identifier"][init.callee.object.name="Array"],
[init.type="CallExpression"][init.optional!=true][init.callee.type="MemberExpression"][init.callee.computed!=true][init.callee.property.type="Identifier"][init.callee.optional!=true]:matches(
  	[init.callee.property.name="concat"],
  	[init.callee.property.name="copyWithin"],
  	[init.callee.property.name="fill"],
  	[init.callee.property.name="filter"],
  	[init.callee.property.name="flat"],
  	[init.callee.property.name="flatMap"],
  	[init.callee.property.name="map"],
  	[init.callee.property.name="reverse"],
  	[init.callee.property.name="slice"],
  	[init.callee.property.name="sort"],
  	[init.callee.property.name="splice"]
	)
  ) > Identifier.id
This is certainly an example where I feel like we went a little off the rails. I don't want to be the person who has to debug that thing when it isn't matching correctly. That's my main gripe with any form of custom domain specific languages. They usually don't come with tooling support at all. If we stay in JavaScript-land instead we can inspect the value at any time at any step with a proper debugger. Whilst the previous string selector example is a bit extreme, the majority of selectors look like this:
BinaryExpressionor:
VariableDeclarationThat's it. Most of the selectors just want to know if the current AST node is of a certain type. Nothing more. For that we don't really need a whole selector engine. What if we introduced a fast path for that and bypassed the selector engine completely?
class NodeEventGenerator {
	// ...

	isType = new Set([
		"IfStatement",
		"BinaryExpression",
		// ...etc
	]);

	applySelector(node, selector) {
		// Fast path, just assert on type
		if (this.isType.has(selector.rawSelector)) {
			if (node.type === selector.rawSelector) {
				this.emitter.emit(selector.rawSelector, node);
			}

			return;
		}

		// Fallback to full selector engine matching
		if (
			esquery.matches(
				node,
				selector.parsedSelector,
				this.currentAncestry,
				this.esqueryOptions
			)
		) {
			this.emitter.emit(selector.rawSelector, node);
		}
	}
}
Since we're already short circuiting the selector engine, I became curious about how a stringified selector would fare against one written as a plain JavaScript function. My gut told me that a selector written as a simple JavaScript condition would be way easier to optimize for engines.
Rethinking selectors
A selector engine is very useful if you need to pass traversal commands across language barriers like we do with CSS in the browser. It never is free though, as a selector engine always needs to parse the selector to deconstruct what we should do, and then build some logic on the fly to execute that parsed thing.
But inside eslint we're not crossing any language barriers. We stay in JavaScript land. Therefore we don't gain anything performance-wise by converting query instructions into a selector and parsing them back into something we can run again. Rather, we consume about 25% of the total linting time for parsing and executing selectors. A new approach was needed.
Then it hit me.
A selector is conceptually nothing more than a "description" to get a find elements based on criterias it holds. That could be a lookup in a tree or a flat data structure like an array. If you think about it, even the callback function in a standard Array.prototype.filter() call is a selector. We're selecting values out of a collection of items (=Array) and picking only the values we care about. What we're doing with the esquery is exactly the same thing. Out of a bunch of objects (=AST nodes), we're picking out the ones which match a certain criteria. That's a selector! So what if we avoided the selector parsing logic and used a plain JavaScript function instead?
// String based esquery selector
const esquerySelector = `[type="CallExpression"][callee.type="MemberExpression"][callee.computed!=true][callee.property.type="Identifier"]:matches([callee.property.name="substr"], [callee.property.name="substring"])`;

// The same selector as a plain JS function
function jsSelector(node) {
	return (
		node.type === "CallExpression" &&
		node.callee.type === "MemberExpression" &&
		!node.callee.computed &&
		node.callee.property.type === "Identifier" &&
		(node.callee.property.name === "substr" ||
			node.callee.property.name === "substring")
	);
}
Let's give this a go! I wrote a few benchmarks to measure the time difference of these two approaches. A little later and the data popped up on my screen.
| What | foo.substr(1, 2) ops/sec |
|---|---|
| esquery | 422,848.208 |
| esquery (optimized) | 3,036,384.255 |
| Plain JavaScript function | 66,961,066.5239 |
Looks like the pure JavaScript function variant easily outperforms the string based one. It's vastly superior. Even after spending all this time on making esquery faster, it's nowhere near the JavaScript variant. In cases where the selector doesn't match and the engine can bail out earlier it was still 30x slower than a plain function. This little experiment confirmed my assumption that we're paying quite of time for the selector engine.
The impact of third-party plugins and presets
Although there is much more room for optimizations visible in the profile from eslint's setup, I began to wonder if I'm spending time optimizing the right thing. Did the same issues we've seen so far in eslint's own linting setup occur in other linting setups too? One of the key strengths of eslint has always been its flexibility and support for third party linting rules. Looking back, pretty much every project I worked on had a couple of custom linting rules and about 2-5 additional eslint plugins or presets installed. But what's more important is that they switched out the parser completely. A quick glance at the npm download stats highlights a trend in replacing eslint's built-in parser:
| Package | npm downloads (weekly) | % |
|---|---|---|
eslint | 31.718.905 | 100% |
@typescript-eslint/parser | 23.192.767 | 73% |
@babel/eslint-parser | 6.057.110 | 19% |
If those numbers are to be believed, it would mean that only 8% of all eslint users use the built-in parser. It also shows how ubiquitous TypeScript has become, making up the lionshare of eslint's total user base with 73%. We don't have data on whether users of the babel parser use it for TypeScript too. My guess would be that a portion of them do that and that the total number of TypeScript users is actually even higher.
After profiling a few different setups in various open source repositories, I settled on the one from vite which contains a good bunch of the patterns that were present in other profiles too. Its codebase is written in TypeScript and eslint's parser has been replaced accordingly.
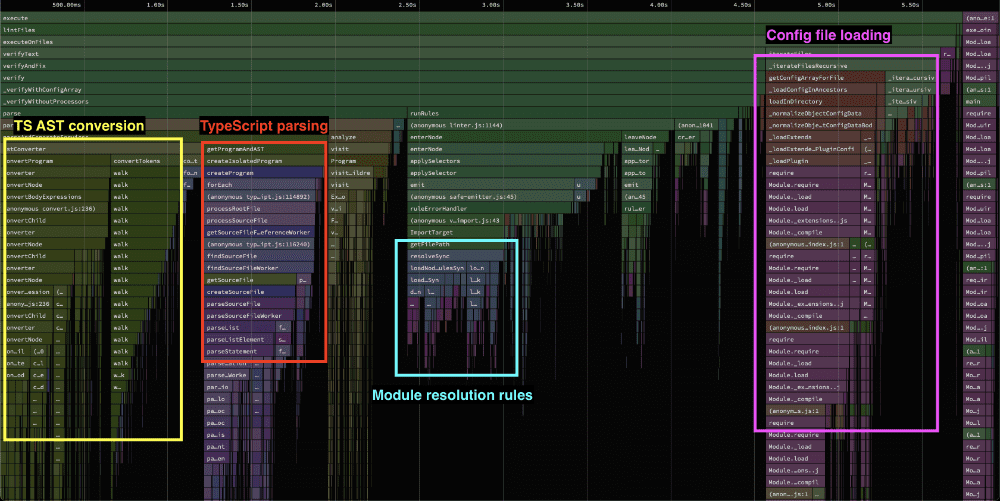
Like before, we can make out various areas in the profile showing where the time is spent. There is an area that hints at a conversion from TypeScript's format to the one eslint understands taking quite a bit of time. Something odd is happening with the configuration loading too, as it never should take up that much time as it does here. And we found an old friend, the eslint-import-plugin and eslint-plugin-node which seem to kickoff a bunch of module resolution logic.
The interesting bit here though is that the overhead of the selector engine doesn't show up at. There are some instances of an applySelector function being called, but it barely consumes any time in the bigger picture.
The two third party plugins that always seem to pop up and take a considerable time to execute are eslint-plugin-import and eslint-plugin-node. Whenever one or both of these plugins were active, it really showed in the profiling data. Both cause heavy filesystem traffic as they try to resolve a bunch of modules, but don't cache the results. We wrote a lot about that in part 2 of this series, so I won't go into more detail on that.
Converting all the AST nodes
We'll start with the TypeScript conversion happening at the beginning. Our tools parse the code we provide to them into a data structure that is known as an Abstract-Syntax-Tree, in short: AST. You can think of that as being the building blocks that all our tooling works with. It tells information like: "hey, here we declare a variable and it has this name and that value", or "here is an if-statement with this condition, that guards that code-block", etc.
// `const foo = 42` in AST form is something like:
{
  type: "VariableDeclaration",
  kind: "const",
  declarations: [
    {
      kind: "VariableDeclarator",
      name: {
        type: "Identifier",
        name: "foo",
      },
      init: {
        type: "NumericLiteral",
        value: 42
      }
  ]
}
You can see for yourself how our tools parse code on the excellent AST Explorer page. I highly recommend visiting that and playing around with various code snippets. It gives you a good understanding of how similar or often different the AST format of our tools are.
However, in eslint's case there is a problem with that. We want rules to work regardless of the parser we've chosen. When we activate the no-console rule we want it to work across all of them and not force each rule to be rewritten for every single parser out there. Essentially, what we need is a shared AST format that we all can agree on. And that's exactly what eslint does. It expects every AST node to match the estree spec which codifies how each AST node should look. It's a spec that has been around for quite a while and many JavaScript tools started out with. Even babel is build on that, but has a few documented deviations since then.
But therein lies the crux of the problem when you're using TypeScript. TypeScript's AST format is very different as it also needs to account for nodes representing the types itself. Some constructs are represent differently internally too as it makes things easier for TypeScript itself. That means every single TypeScript AST node has to be converted to the format eslint understands. That conversion takes time. In this profile that accounts for ~22% of the total time. The reason it takes so long is not just the traversal alone, but also that with every conversion we'll be allocating new objects. We basically have two copies in different AST formats in memory.
Maybe babel's parser is faster? What if we swapped out @typescript-eslint/parser with @babel/eslint-parser?
| What | Parse time |
|---|---|
@typescript-eslint/parser | 2.1s |
@babel/eslint-parser + @babel/preset-typescript | 0.6s |
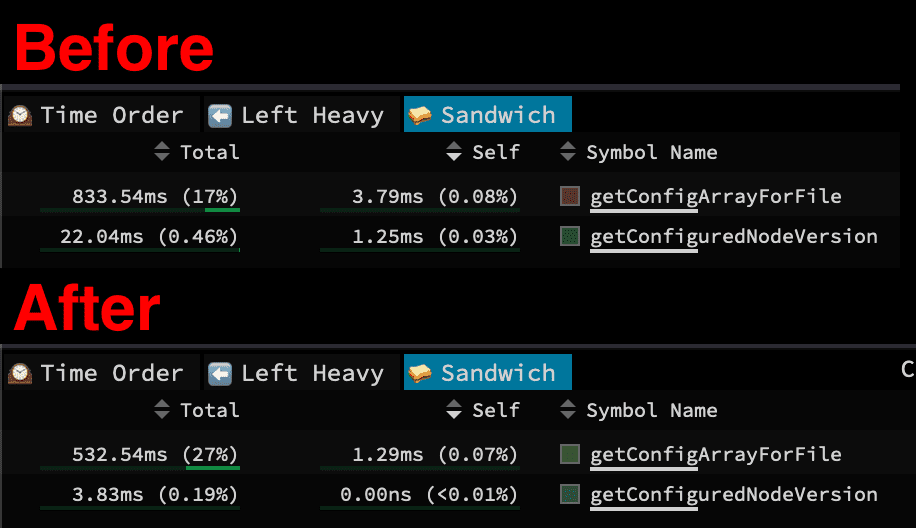
Turns out that doing just that saves us quite a bit of time. Interestingly, this change also cut down the config loading time by a good chunk. The improvement to the config load time is probably due to babel's parser being spread out in fewer files.
Note that whilst the babel parser is (at the time of this writing) noticeably faster, it doesn't support type-aware linting. That's a feature exclusive to @typescript-eslint/parser. This opens up the possibilities for rules like their no-for-in-array rule, which can detect if the variable you're iterating over in a for-in loop is actually an object instead of an array. So you might want to continue using @typescript-eslint/parser. If you are confident that you don't use any of their rules though and you are just looking for eslint to be able to understand TypeScript's syntax, plus be a little quicker to lint, then switching to babel's parser is a good option.
Bonus round: What would an ideal linter look like?
Around this point I stumbled upon a discussion about the future of eslint, with performance being one of the top priorities. There are some great ideas put forth in there, especially about introducing the notion of a session to allow for full program linting vs on a per file basis like it is done today. Given that around at least 73% of eslint users use it to lint TypeScript code, a tighter integration that requires less AST conversion would also be huge in regards to performance.
There is also some chatter about a rust port, which piqued my curiosity on how fast current rust-based linters for JavaScript are. The only one that seems to be somewhat production ready and able to parse a large portion of the TypeScript grammar is rslint.
Besides rslint, I also began to wonder what a simple linter in pure JavaScript would look like. One that didn't have a selector engine, didn't require constant AST conversion, and just the necessities to parse code and check various rules on it. So I wrapped babel's parser with a very simple API and added custom traversal logic to walk the AST tree. I didn't pick babel's own traversal functions because they cause lots of allocations with every iteration and are built on generators which is a little slower than not using generators. Also tried it with a few custom JavaScript/TypeScript parsers that I wrote myself over the years which originated from porting esbuild's parser to JavaScript a couple of years back.
With that said, here are the numbers when running them all on vite's repository (144 files).
| What | Time |
|---|---|
| eslint (JavaScript) | 5.85s |
| Custom linter (JavaScript) | 0.52s |
| rslint (rust based) | 0.45s |
Based on these numbers I'm fairly confident that we can get very close to rust's performance with just JavaScript based on this little experiment.
Conclusion
Overall, the eslint project has a very bright future ahead. It's one of the most successful OSS projects and it has found the secret of getting a good amount of funding. We looked at a couple of things that would make eslint faster, and there are lots more areas to look into that weren't covered here.
The "future of eslint" discussion contains a lot of great ideas that would make eslint better and potentially faster. I think the tricky bit is avoiding trying to fix every problem at once as that's often doomed to fail in my experience. Same goes for a ground up rewrite. Instead, I think that the current code base is a perfectly good starting point, ready to be shaped into something even more awesome.
From an outsiders perspective, there are some key decisions to make. Like, does it make sense at this point to keep supporting string based selectors? If yes, does the eslint team have the capacity to take on maintenance of esquery and give it some much needed love? And what about native TypeScript support given that the npm download counts point at 73% of eslint users being TypeScript users?
Whatever will happen, I have strong confidence in their team and the ability to execute their vision. I'm excited for the future of eslint!