

Speeding up the JavaScript ecosystem - The barrel file debacle

tl;dr: Many projects are littered with files that just re-export other files. These so called "barrel files" are one of the key reasons why JavaScript tooling is slow in bigger projects.
- Part 1: PostCSS, SVGO and many more
- Part 2: Module resolution
- Part 3: Linting with eslint
- Part 4: npm scripts
- Part 5: draft-js emoji plugin
- Part 6: Polyfills gone rogue
- Part 7: The barrel file debacle
- Part 8: Tailwind CSS
- Part 9: Server Side JSX
- Part 10: Isolated Declarations
- Part 11: Rust and JavaScript Plugins
- Part 12: Semver
- Part 13: oxlint and oxfmt
Let's imagine you are working on a big project with many files. You add a new file to work on a new feature and import a function from another directory into your code.
import { foo } from "./some/other-file";

export function myCoolCode() {
	// Pretend that this is super smart code :)
	const result = foo();
	return result;
}
Excited about finishing your feature, you run the code and realize that it takes an awfully long time to complete. The code you've written is pretty straight forward and shouldn't consume that much time. Concerned by this, you sprinkle in some measuring code to see how long your function took to do its thing.
import { foo } from "./some/other-file";

export function myCoolCode() {
	console.time();
	const result = foo();
	console.timeEnd();
	return result;
}
You run the code again, and to your surprise the measurements you inserted show that it's blazing fast™. You repeat the measuring steps, but this time insert the console.time() statements in the main entry file of your project and run the code again. But no dice, the logged measurements just confirm that your code itself is super fast. What is happening?
Well, strap in. This is the story of the devastating effects barrel files have on your code.
Gathering more information
The key piece of information we have obtained so far is that the runtime of the code isn't the issue. You measured it, and it was a fraction of the total time. This means we can assume that all the other time is wasted either before or after running our code. From experience when it comes to tooling, the time is usually spent before running the project code.
You got an idea: You remember hearing that some npm packages pre-bundle their code for performance reasons. Maybe this could help here? You decide to test that theory and bundle your code with esbuild into a single file. You purposely disable any forms of minifications, because you want your code to be as close as possible to the original source.
Upon completion, you then run the bundled file to repeat the experiment and voilá, it finishes in a blink of an eye. Out of curiosity, you measure the time it takes to run esbuild and run the bundled file together and notice that both of them combined are still quicker than running the original source code. Huh? What is going on?
Then it hits you: The main thing a bundler does is flatten and merge the module graph. What was once composed of thousands of files, is merged into a single file thanks to esbuild. This would be a strong indicator that the size of the module graph is the true problem here. And barrel files are the main cause of that.
Anatomy of a barrel file
Barrel files are files that only export other files and contain no code themselves. As a non-native speaker that term is confusing to me, but let's roll with it. In the days before editors had auto imports and other niceties, many developers tried to keep the number of import statements they had to write by hand to a minimum.
// Look at all these imports
import { foo } from "../foo";
import { bar } from "../bar";
import { baz } from "../baz";
This gave rise to a pattern where every folder got its own index.js file that merely re-exported code from other files in usually the same directory. In a way this amortized the manual typing work because once such a file is in place, all the other code only needs to reference one import statement.
// feature/index.js
export * from "./foo";
export * from "./bar";
export * from "./baz";
The previously shown import statements can now be collapsed into a single line.
import { foo, bar, baz } from "../feature";After a while, this pattern spreads throughout the codebase and every folder in your project has an index.js file. Kinda neat, isn't it? Well, no.
Everything is not fine
In such a setup a module very likely imports another barrel file which pulls in a bunch of other files, which then imports yet another barrel file and so on. Ultimately, you typically end up importing every single file in your project through a spiderweb of import statements. And the bigger the project, the longer it takes to load all of these modules.
Ask yourself: What's quicker? Having to load 30k files or just 10? Probably only loading 10 files is faster.
It's a common misconception among JavaScript developers that modules would only be loaded when needed. This is not true, because doing so would break code relying on globals or module execution order.
// a.js
globalThis.foo = 123;

// b.js
console.log(globalThis.foo); // should log: 123

// index.js
import "./a";
import "./b";
If the engine wouldn't load the first ./a import, then the code would unexpectedly log undefined instead of 123.
Effects of barrel files on performance
It gets worse when you take tools like test runners in consideration. In the popular jest test runner, each test file is executed in its own child process. In effect, this means that every single test file constructs the module graph from scratch and has to pay for that cost. If constructing the module graph in a project takes 6s and you have - let's say - only 100 test files, then you waste 10 minutes in total to repeatedly construct the module graph. No test or any other code is being run during that time. It's just the time the engine needs to prepare the source code so that it can then be run.
Another area where barrel files gravely affect performance is any sort of import cycle linting rules. Typically linters are run on a file-by-file basis, which means the cost of constructing the module graph needs to be paid for every single file. It's not uncommon that this alone causes linting times to spiral out of control and suddenly linting takes a couple of hours in a bigger project.
To get some raw numbers, I've generated a project with files importing each other to get a better sense of the cost of constructing the module graph. Every file is empty and contains no code other than import statements. Timings are measured on my MacBook M1 Air (2020).
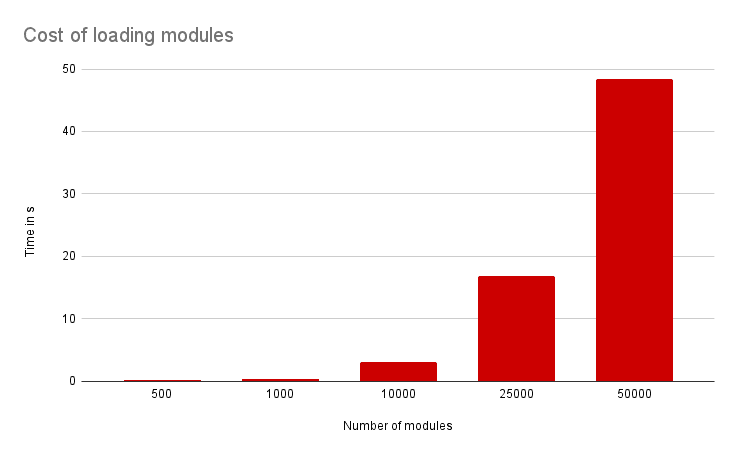
As you can see, loading fewer modules is very much worth it. Let's apply these numbers to a project with 100 test files where a test runner is used that spawns a new child process for each test file. Let's be generous here and say that our test runner can run 4 tests in parallel:
- 500 modules:
0.15s * 100 / 4=3.75soverhead - 1000 modules:
0.31s * 100 / 4=7.75soverhead - 10000 modules:
3.12s * 100 / 4=1:18moverhead - 25000 modules:
16.81s * 100 / 4=~7:00moverhead - 50000 modules:
48.44s * 100 / 4=~20:00moverhead
Since this is a synthetic setup, these are lowball numbers. In a real project these numbers are likely worse. Barrel files are not good when it comes to tooling performance.
What to do
Having only a handful of barrel files in your code is usually fine, but it gets problematic when every single folder has one. It's unfortunately not a rare occurrence in the JavaScript industry.
So if you work on a project which uses barrel files extensively, there is a free optimization you can apply that makes many tasks 60-80% faster:
Get rid of all barrel files.