Speeding up the JavaScript ecosystem - npm scripts
tl;dr: 'npm scripts' are executed by JavaScript developers and CI systems all around the world all the time. Despite their high usage they are not particularly well optimized and add about 400ms of overhead. In this article we were able to bring that down to ~22ms.
- Part 1: PostCSS, SVGO and many more
- Part 2: Module resolution
- Part 3: Linting with eslint
- Part 4: npm scripts
- Part 5: draft-js emoji plugin
- Part 6: Polyfills gone rogue
- Part 7: The barrel file debacle
- Part 8: Tailwind CSS
- Part 9: Server Side JSX
- Part 10: Isolated Declarations
- Part 11: Rust and JavaScript Plugins
- Part 12: Semver
If you’re working with JavaScript you’ve likely used the "scripts" field in package.json to set up common tasks for your project. Those scripts can be executed with npm run on the terminal. I noticed that I opted more and more to just call the underlying command directly instead of shelling out to npm run, mostly because it's noticeably faster. But what makes them so much slower in comparison? Time for a profiling session!
Loading only the code you need
What many developers don’t know is that the npm CLI is a standard JavaScript file and can be invoked like any other .js file. On macOS and Linux you can get the full path to the npm cli by running which npm. Dumping that file to the terminal reveals that it's a boring standard .js file. The only special thing is the first line which tells your shell with which program the current file can be executed with. Since we're dealing with a JavaScript file that would be node.

Because it's just a .js file we can rely on all the usual ways to generate a profile. My favorite one is node’s --cpu-prof argument. Combine that knowledge together and we can generate a profile from an npm script via node --cpu-prof $(which npm) run myscript. Loading that profile into speedscope reveals quite a bit about how npm is structured.
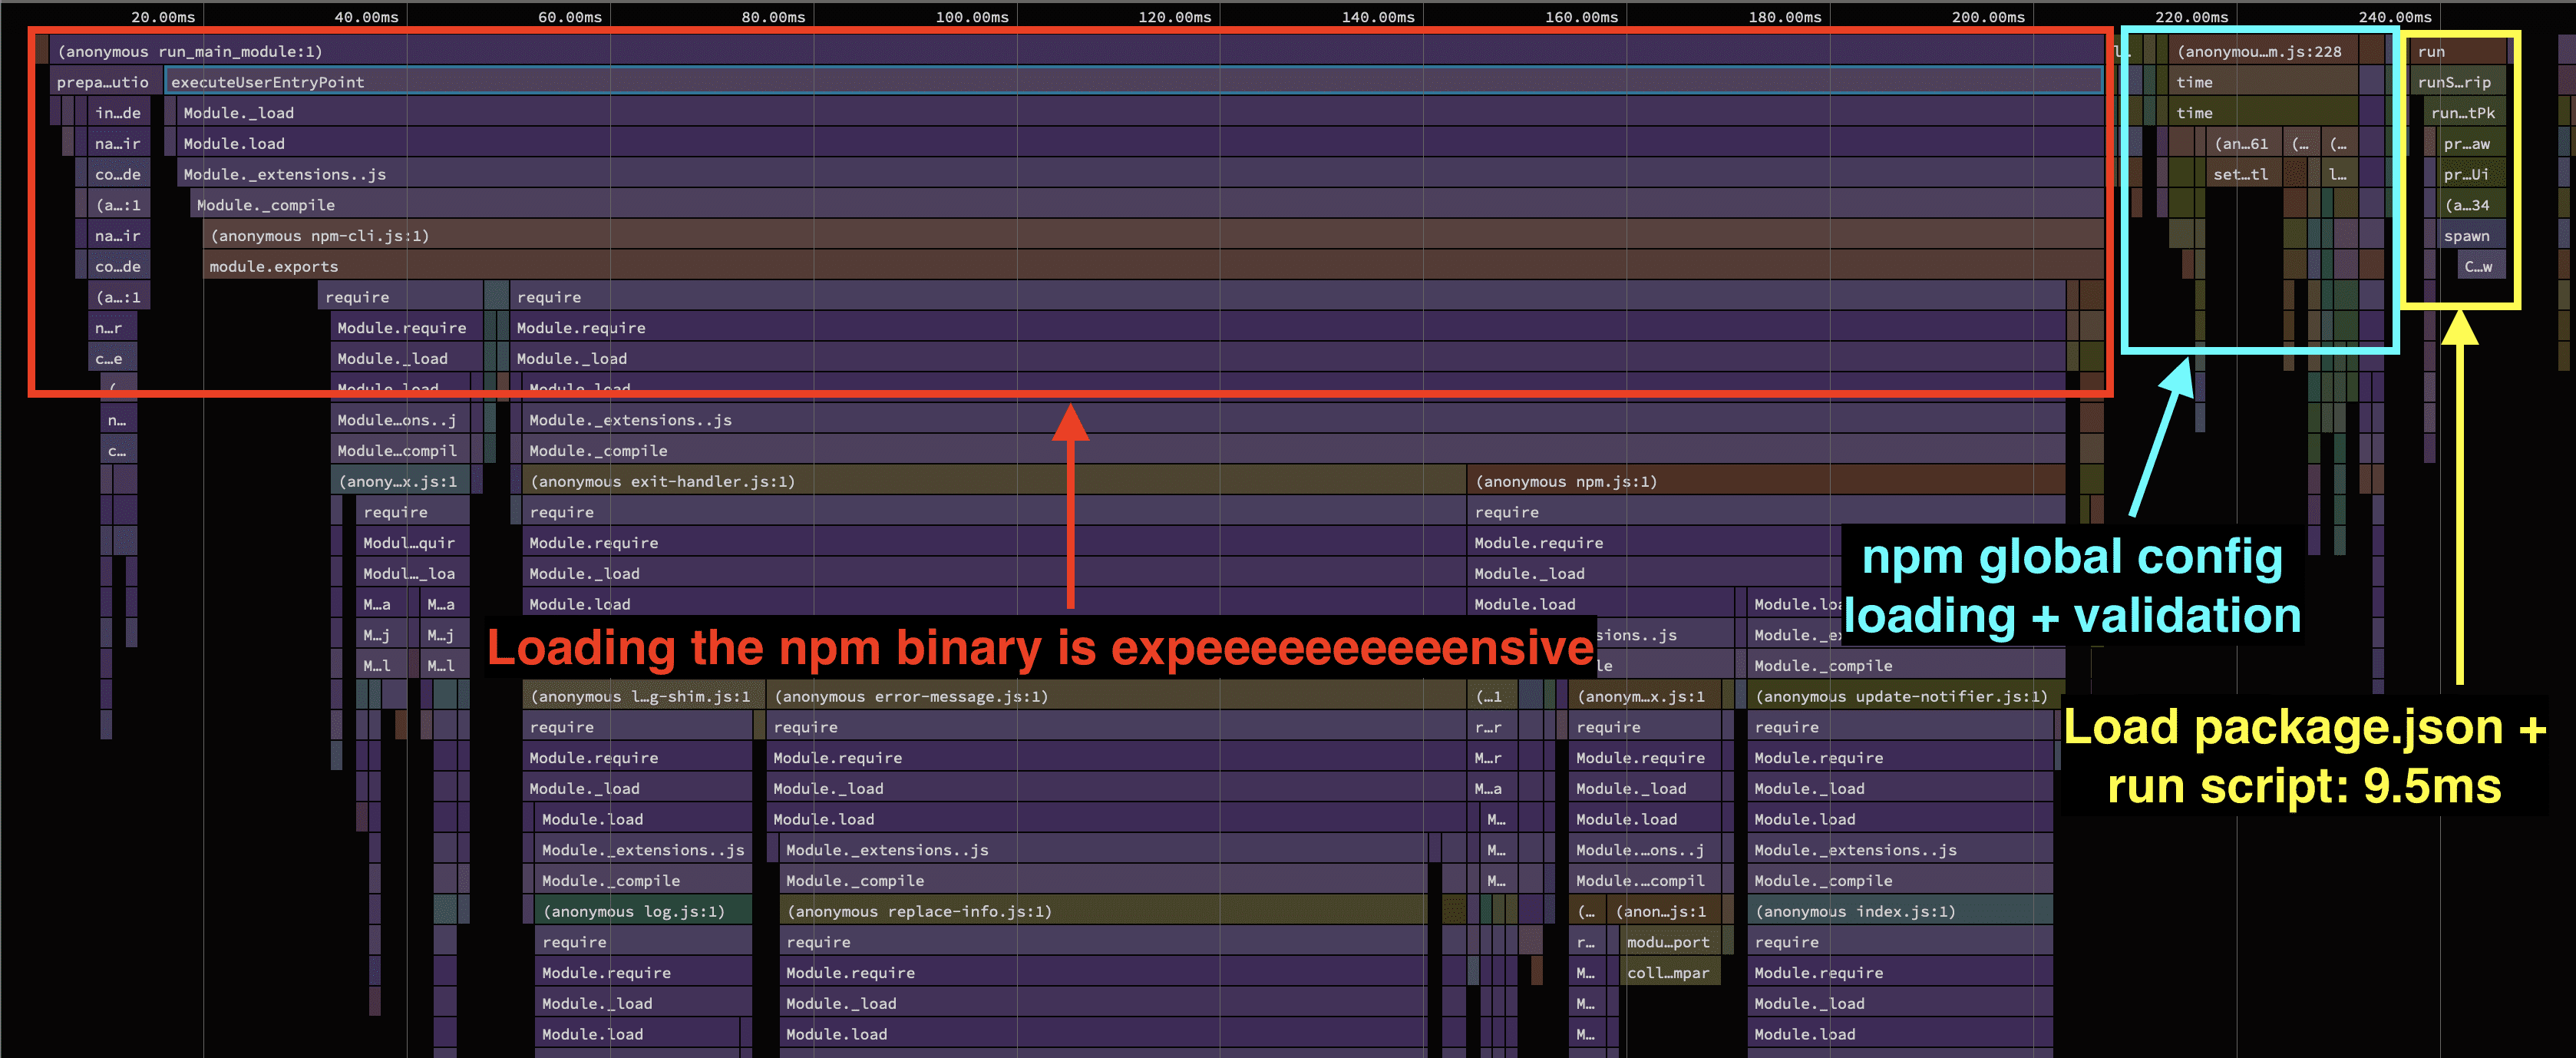
The majority of time is spent on loading all the modules that compose the npm cli. The time of the script that we’re running pales in comparison. We see a bunch of files which only seem to be necessary once certain conditions are met. An example of that would be code for formatting error messages that's only needed when an error occurred.
Such a case exists in npm where an exit handler is required eagerly. Let's require that module only when we need it.
  // in exit-handler.js
  const log = require('./log-shim.js')
- const errorMessage = require('./error-message.js')
- const replaceInfo = require('./replace-info.js')

  const exitHandler = err => {
    //...
    if (err) {
+     const replaceInfo = require('./replace-info.js');
+     const errorMessage = require('./error-message.js')
      //...
    }
  };
Comparing the profile after this change with the one without it doesn't show any difference in the total time taken. That is because the modules that we changed to be lazily loaded here are eagerly required elsewhere. To properly lazy load them we need to change all sites where it's required.
Next up I noticed that a bunch of code related to npm’s audit feature was loaded. This seems odd, since I’m not running anything related to auditing. Unfortunately for us, it’s not as easy as just moving some require calls around.
One class to rule them all
A recurring problem in various js tools is that they are composed of a couple of big classes that pull in everything instead of only the code you need. Those classes always start out small and with good intentions to be lean, but somehow they just get bigger and bigger. It becomes harder and harder to ensure that you're only loading the code you need. This reminds me of this quote from Joe Armstrong (creator of the Erlang programming language):
"You wanted a banana but what you got was a gorilla holding the banana and the entire jungle." – Joe Armstrong
Inside npm is an Arborist class which pulls in a lot of things that are only needed for specific commands. It pulls in things related to modifying the layout and packages in node_modules, auditing package versions and a bunch of other things that are not needed for the npm run command. If we want to optimize npm run we need to boot them off of the eagerly loaded modules list.
const mixins = [
	require("../tracker.js"),
	require("./pruner.js"),
	require("./deduper.js"),
	require("./audit.js"),
	require("./build-ideal-tree.js"),
	require("./load-workspaces.js"),
	require("./load-actual.js"),
	require("./load-virtual.js"),
	require("./rebuild.js"),
	require("./reify.js"),
	require("./isolated-reifier.js"),
];

const Base = mixins.reduce((a, b) => b(a), require("events"));
class Arborist extends Base {
	//...
}
For our purposes all the modules loaded in the mixins array, which the Arborist class later extends on, are not needed. We can drop all of them. This change gains us savings of about 20ms, which might not seem like much, but those savings add up. Like before, we need to check other places where those modules are required to ensure that we're really loading it on demand only.
Reducing the size of the module graph
Changes to a couple of require statements here and there are nice, but won't sway the numbers substantially. The bigger issue are dependencies which often have one main entry file which pulls in all the code of said module. Ultimately, the problem is that when the engine sees a bunch of top level import or require statements, it is going to parse and load those modules eagerly. No exceptions. But this is exactly what we want to avoid here.
A concrete example of that is the cleanUrl function that is imported from the npm-registry-fetch package. Like the name implies, that package is all about doing network stuff. But we don't do any sort of network requests in npm run when running a script. That's another 20ms saved. We don't need to display a progress bar either, so we can drop code for that too. Same is true for a bunch of other dependencies that the npm cli uses.
The amount of modules you load is a very real problem for these scenarios. It's no surprise that libraries for which start up time is critical have turned to bundlers to merge all their code into fewer files. Engines are pretty good with loading big blobs of JavaScript. The main reason we care so much about file size on the web is the cost of having to deliver those bytes over the network.
There are tradeoffs to this approach though. The bigger the file, the longer it takes to parse it, so there will be a threshold after which the parse cost of a single gigantic file is higher than splitting it up. As always: Measuring will show you if you hit that tradeoff. Another thing to consider is that bundlers cannot bundle code written for the CommonJS module system as efficiently as code that’s authored in ESM. Typically they introduce a lot of wrapper code around CommonJS modules which nullifies most of the benefits of bundling the code in the first place.
Sorting all the strings
With each reduction of the module graph the profile became less noisy and revealed other areas which could be improved. A particular call to a collaterCompare function caught my eye.
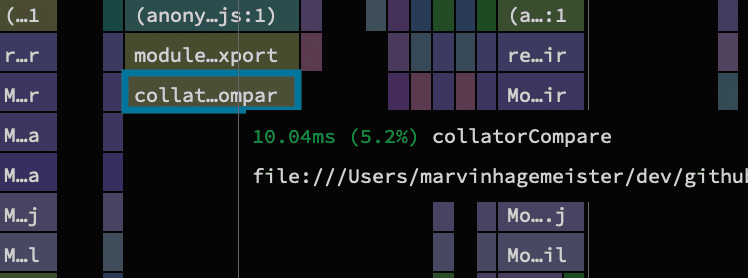
You might be thinking that 10ms isn’t worth it to spend time investigating it, but in this profile it's more of a "death by a thousand paper cuts" sort of thing. There is no single big entry that makes everything fast. So spending improving even smaller call sites is very much worth it. What’s interesting about this one for the collatorCompare function is that it’s intended purpose is to sort strings in a locale aware fashion. The implementation is split in two parts to achieve that: An initializing function and the function it returns which does the actual comparison.
// Simplified example of the code in @isaacs/string-locale-compare

const collatorCompare = (locale, opts) => {
	const collator = new Intl.Collator(locale, opts);
	// Always returns a new function that needs to be optimized from scratch
	return (a, b) => collator.compare(a, b);
};

const cache = new Map();
module.exports = (locale, options = {}) => {
	const key = `${locale}\n${JSON.stringify(options)}`;

	if (cache.has(key)) return cache.get(key);

	const compare = collatorCompare(locale, opts);
	cache.set(key, compare);
	return compare;
};
If we look at all the places this module is loaded at, we can see that we are only ever interested in sorting English strings and never pass any additional options aside from the locale. But because of the way this module is structured, every new require call will nudge folks to create a brand new comparison function that needs to be optimized all over again.
// Every require call immediately calls the "default" export with "en"
const localeCompare = require("@isaacs/string-locale-compare")("en");
But ideally we want everyone to use the same comparison function. With that in mind we can replace the code with a two-liner where we create the Intl.Collator once and create the localeCompare function only once too.
// We only ever need to construct the Collator class instance once
const collator = new Intl.Collator("en");
const localeCompare = (a, b) => collator.compare(a, b);
At one particular place, npm holds a sorted list of available commands. That list is hard coded and will never change at runtime. It only consists of ascii strings, so we can use plain old .sort() instead of our locale aware function.
  // This array only contains ascii strings
  const commands = [
    'access',
    'adduser',
    'audit',
    'bugs',
    'cache',
    'ci',
    // ...
- ].sort(localeCompare)
+ ].sort()
With this change the time it takes to call that function is close to 0ms. Another 10ms saved since this was the last place which loaded this module eagerly.
To note here is that at this point we’ve made npm run twice as fast. We’re now down to ~200ms from the ~400ms we started with. Looking good!
Setting process.title is expensive
Another function call that jumped out was this call to a setter for a mysterious title property. 20ms for setting a property seems expensive.
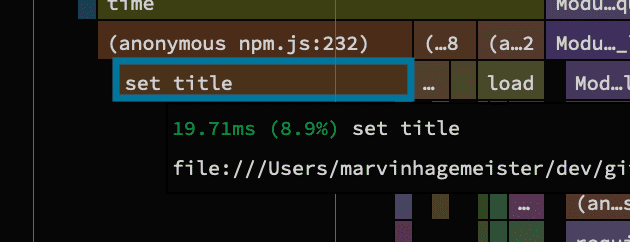
The implementation of that setter is surprisingly simple:
class Npm extends EventEmitter {
	// ...
	set title(t) {
		// This line is the culprit
		process.title = t;
		this.#title = t;
	}
}
Changing the title of the current running process seems to be a pretty expensive operation. This feature is really useful though, because it makes it easier to spot specific npm processes in the task manager when you have multiple ones running at the same time. For the sake of this investigation I didn’t look further and commented that part out. Nonetheless, I think it might be worth to look deeper into what's making it so costly.
Globbing log files
Another entry in the profile that drew my attention was a call to another string sorting function inside the glob module. It’s pretty odd that we’re even globbing here at all when all we want to do is run npm scripts. The glob module is used to crawl the file system for files matching a user defined pattern, but why would we need that? The majority of time seems to be spent not searching the file system but rather sorting strings ironically.
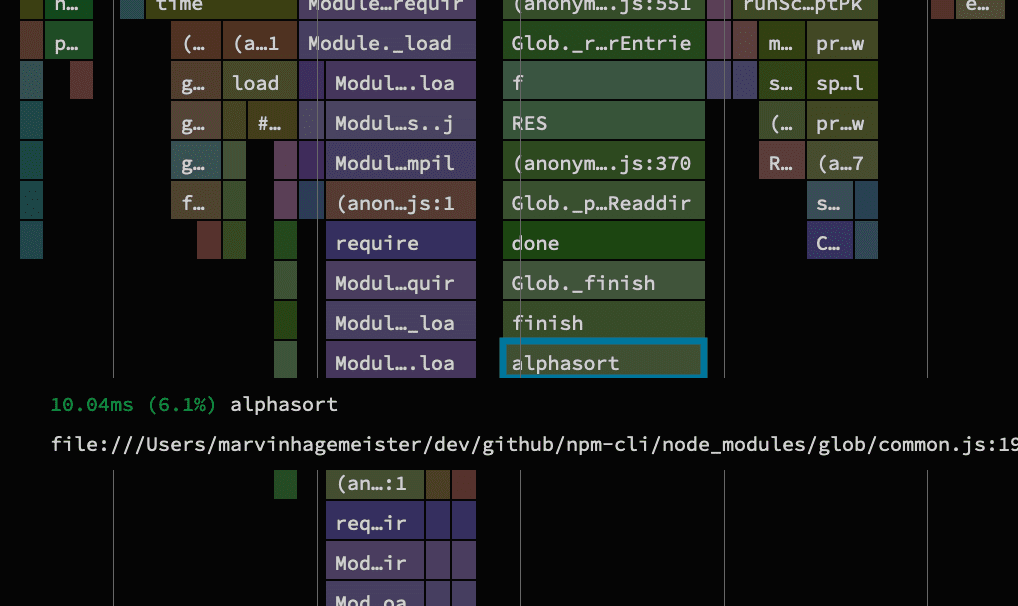
This function is only called once with a simple array of 11 strings and sorting that should be instant. Strangely, the profile showed that this took ~10ms.
// Sorting this array somehow takes 10ms
[
	"/Users/marvinhagemeister/.npm/_logs/2023-03-18T20_06_53_324Z-debug-0.log",
	"/Users/marvinhagemeister/.npm/_logs/2023-03-18T20_07_35_219Z-debug-0.log",
	"/Users/marvinhagemeister/.npm/_logs/2023-03-18T20_07_36_674Z-debug-0.log",
	"/Users/marvinhagemeister/.npm/_logs/2023-03-18T20_08_11_985Z-debug-0.log",
	"/Users/marvinhagemeister/.npm/_logs/2023-03-18T20_09_23_766Z-debug-0.log",
	"/Users/marvinhagemeister/.npm/_logs/2023-03-18T20_11_30_959Z-debug-0.log",
	"/Users/marvinhagemeister/.npm/_logs/2023-03-18T20_11_42_726Z-debug-0.log",
	"/Users/marvinhagemeister/.npm/_logs/2023-03-18T20_12_53_575Z-debug-0.log",
	"/Users/marvinhagemeister/.npm/_logs/2023-03-18T20_17_08_421Z-debug-0.log",
	"/Users/marvinhagemeister/.npm/_logs/2023-03-18T20_21_52_813Z-debug-0.log",
	"/Users/marvinhagemeister/.npm/_logs/2023-03-18T20_24_02_611Z-debug-0.log",
];
The implementation looks pretty harmless too.
function alphasort(a, b) {
	return a.localeCompare(b, "en");
}
But maybe we can use the Intl.Collator object instead that we used earlier to compare these strings.
const collator = Intl.Collator("en");
function alphasort(a, b) {
	return collator.compare(a, b);
}
And that did the trick. I’m not entirely sure why String.prototype.localeCompare is slower in comparison. It definitely sounds fishy. But I can reliably verify the speed difference on my end. The Intl.Collator approach is consistently faster for this particular call.
The bigger fish is that searching the file system for log files seems at odds with our intentions. It’s super useful that a log file is written and cleared if the command was successful, but shouldn’t we know the names of the files we wrote if we are the ones who created them in the first place? I took a stab at changing that, but for the sake of this article I decided to comment that out and continue the investigation.
At this point we’re down to ~138ms from the ~400ms at the beginning. Although that’s already a pretty nice improvement we could do a lot better.
Deleting all the things
I felt like I needed to become a little more aggressive with deleting or uncommenting code that’s not related to running npm scripts. We’ve done our fair share so far and we could continue on that path, but I got curious about what the northstar time is that we should shoot for. The basic goal is to only load code that is absolutely necessary to execute npm scripts. Everything else is merely overhead and time wasted.
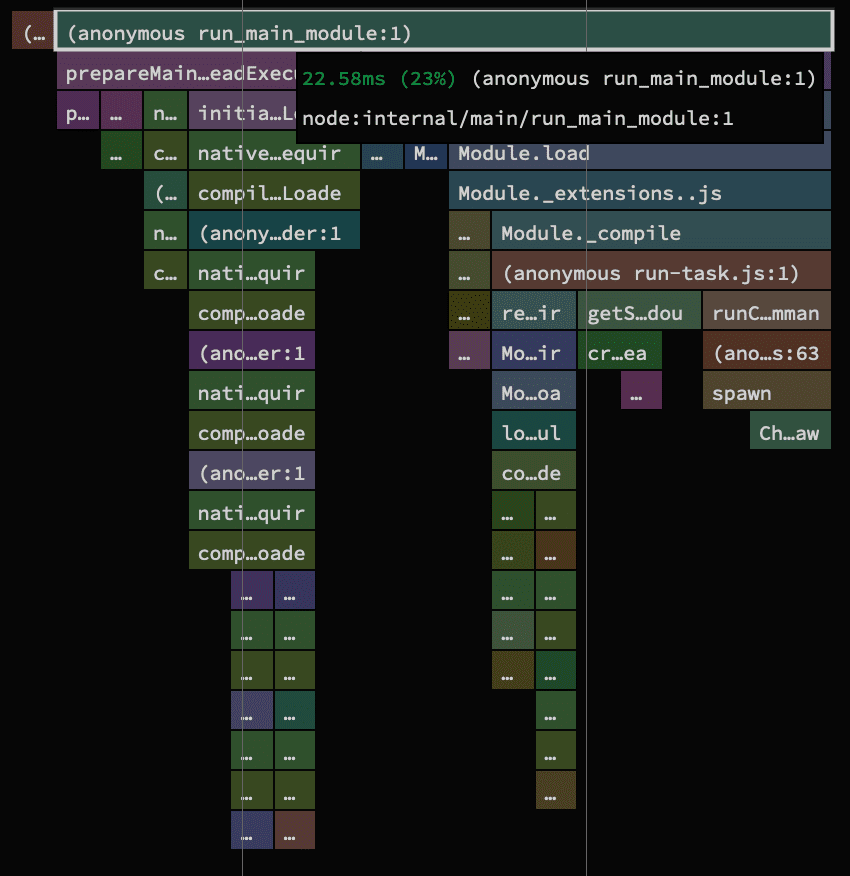
So I went out and wrote a short script that does the bare minimum necessary to run npm scripts. In the end I got it down to about 22ms, which is about 18x faster than the 400ms we started with. I'm pretty happy with that although 22ms still feels like a lot of time compared to what it does. It's certainly something where other languages like Rust excel at in comparison. Regardless, there is a point to be made that 22ms is fast enough for now.
Conclusion
On the surface it seems strange that we spent that much time making the npm run command about 380ms faster. However, if you think about how often that command is executed by developers all over the world and how often it is executed inside a CI, those savings add up pretty quickly. It's nice to have have more snappier npm scripts too for local development too, so there is definitely the angle of personal benefit
But the big elephant in the room remains: There is no easy way to short circuit the module graph. All JavaScript tools I looked at so far have this problem. Some tools have this more pronounced and others are less affected. The overhead of resolving and loading a bunch of modules is very real. I’m not sure what the long term solution to that will be or if that is solvable by JavaScript engines themselves.
Until a proper solution is found, a viable workaround that we can apply today is bundling the code when publishing it to npm. I’m secretly hoping though that this isn’t the only viable path forward and that all runtimes improve on that front. The less tooling we have to deal with, the more beginner friendly we are as an ecosystem.
